Capturing & Analysing Packets: Taking a tcpdump
- By E. Ewusi-Essel

tcpdump is essentially a command-line based packet capturing utility that allows us to capture and monitor traffic on a network. It enables us to inspect traffic from almost all layers of the OSI model. Captured packets can preferably be stored for later analysis in Wireshark. Despite its name, tcpdump can be used to capture non-TCP traffic such as UDP, ICMP, or ARP.
My aim is to give an overview of the basics of how to use the tcpdump command on a Linux machine. It is noteworthy that tcpdump is installed by default on most Linux and macOS distributions. For this guide, I will use tcpdump on a Kali Linux machine.
Getting Started
Before we begin it is always good practise to check what version of tcpdump command we have available on our system, this is done with the command:
tcpdump –version
Installation
Tip: if tcpdump is not present on your system, this can be fixed by installing it with the package manager of your distro i.e. for Ubuntu & Debian:
sudo apt update && sudo apt install tcpdump
General Syntax
A typical syntax for tcpdump command is as follows:
tcpdump [option] [expression]
Best practise dictates that we always specify the interface, -i eth0 is an [option] specifying the network interface. Various flags and parameters can be added to tcpdump command to modify its behaviour. Below we specified the network interface to capture data from.
This is often followed by defining the criteria or [expression] to filter. The filtering can be based on IP addresses, port numbers, protocols, and more. For now lets just focus on using this syntax as our starting point.
tcpdump -i eth0
Tip: tcpdump can only be run by a root or user with sudo privileges. it is good practise to always specify your target interface as a required ‘option’
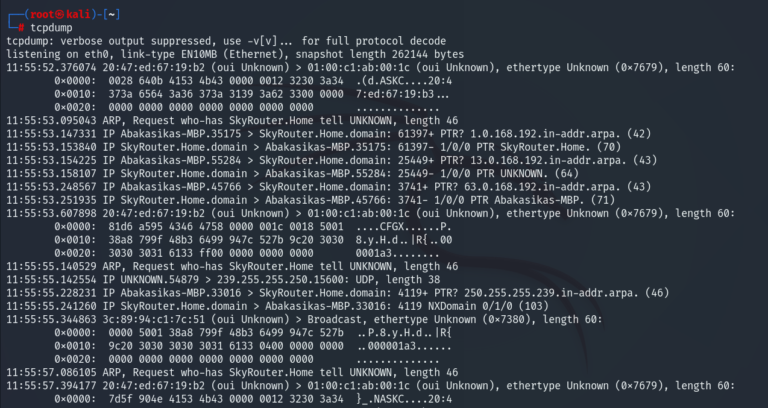
When we run a simple tcpdump without option and filters this is the output:

The command will continue to capture and write to the standard output until it receives an interrupted signal
Tip: The Ctrl + C key combination will stop the command
Common Options
For a verbose (prints out all the traffic captured) output, we add the -v option or -vv for an even more verbose output.
tcpdump -v
We can specify the number of packets to be captured using the -c option. For instance to capture just 10 packets we would type:
tcpdump -c 10
The -D option will output a list of all available network interfaces it can collect packets from
tcpdump -D
Tip: When no interface is specified, tcpdump will use the first interface it detects and capture all packets passing through it.

The first interface available to us is our ethernet – eth0. For the remainder of this guide it will be the option we use throughout.
Packet Header Capture Explained

Filters
Filters are an important feature of using tcpdump allowing us to capture only the specific network traffic we are interested in. Without filters, it would capture all packets, which can be overwhelming producing large amounts of data. Filters help narrow down the packet capture to relevant traffic, making analysis more efficient and focused.
Filtering by Host
To capture packets only related to a specific host, targeting my virtual machines ip address, we use:
tcpdump -i eth0 -n host 192.168.0.63
Tip: By default, tcpdump performs reverse DNS resolution on IP addresses and translates port numbers into names. Use the -n option to disable the translation
Filtering by Source and Destination
Packets can be filtered based on the source or destination ip using the src, ‘dst’, ‘src’ and ‘dst’ and ‘src or dst’ qualifiers.
tcpdump -i eth0 -n src 192.168.0.63
tcpdump -i eth0 -n dst 192.168.0.63
Filtering by Protocol
We can restrict the capture to a particular protocol, for example to capture only the TCP traffic we would run:.
tcpdump -i eth0 -n udp
$ tcpdump -i eth0 -n proto 6
Tip: There is another way to define protocol by using the proto qualifier followed by the protocol number, this command will produce the same result as the one above. More information about IP protocol numbers list can be found here: https://en.wikipedia.org/wiki/List_of_IP_protocol_numbers
Filtering by Port
In order to capture packets from or to a specific port we use the port qualifier. The command bellow will capture packets related to the SSH(port 22)
tcpdump -i eth0 -n port 22
The portrange qualifier will allow us to capture traffic in a range of ports:
tcpdump -i eth0 -n portrange 2300-8000
Combining Complex Filters
This is where it gets interesting. Filters can be combined using and, or and not operators aka booleans. So to capture all HTTP traffic coming from source IP address: 192.168.0.63 we would use:
tcpdump -i eth0 -n src 192.168.0.63 and tcp port 80
Parentheses can be used to group and create more complex filters:
tcpdump -i eth0 -n ‘host 192.168.0.63 and (tcp port 80 or tcp port 443)’
Tip: to avoid parsing errors when using special characters its advised to enclose the filters inside single quotes.
Here is another example command to capture all traffic except SSH from my source IP address
tcpdump -i eth0 -n src 192.168..0.63 and not dst port 22
Scanning Network Range
Scanning network ranges is a fundamental task in network security. In order to specify our network or the entire subnet, the net command is used. This command specifies the entire range and will capture traffic from all devices on this network range.
tcpdump -i eth0 -v net 192.168.0.63/24
Packet Inspection
By now we know that by default the tcp command captures only packet headers. When sometimes we need to inspect the content of the packets. tcpdump can allow us to print the content of the packets in ASCII and HEX
ASCII: ASCII (American Standard Code for Information Interchange)
ASCII is a character encoding standard used to represent text in computers and other devices that use text.
HEX, short for hexadecimal, is a base-16 numbering system used in mathematics and computer science.
The -A option tells tcpdump to print each packet in ASCII and for HEX -x (small x):
tcpdump -i eth0 -n -A
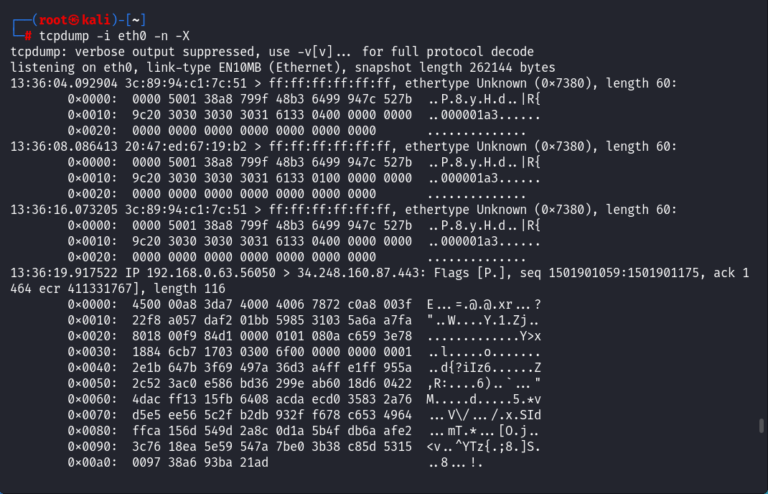
Alternatively you can choose to display packet contents in both HEX and ASCII we use the -X option
tcpdump -i eth0 -n -X

Reading and Writing Captures to a File
A handy feature of using tcpdump is its ability to write packets to a file, especially when capturing large volumes of packets for subsequent analysis.
To start writing to a file, we use the -w option followed by the name of the output file, this will be saved in the current working directory:
tcpdump -i eth0 -c 10 -w traffic.pcap
TIP: the file extension pcap stands for (packet capture)
To examine the contents of the packet file, use tcpdump with the -r option.
$ sudo tcpdump -r traffic.pcap

Good To Know: the capture file can be analysed with other packet analyzer tools such as Wireshark
I found this very fascinating, when capturing packets over an extended period, you can enable file rotation with tcpdump. This allows you to create new files and rotate the tcpdump file based on a specified time interval or fixed size.
The following command will create up to ten 100MB files, named traffic.pcap0, traffic.pcap1, and so forth, before overwriting older files.
tcpdump -n -W 10 -C 200 -w traffic.pcap
Pro Tip: this is useful when running tcpdump during troubleshooting
You can use the timeout command to stop tcpdump after a set period. For instance, to exit after 3 minutes, you would use:
timeout 180 tcpdump -n -w traffic.pcap
Conclusion
tcpdump is a command-line utility with immense capabilities used for analysing and troubleshooting network-related problems. This post provided an introduction to the basics of tcpdump usage and syntax. For more detailed documentation, one can visit the tcpdump website.
